
Grafana
Grafana is an open-source dashboarding tool, most often used for time series. Use it with Opteryx to put data from opteryx.app, the hosted service, on the same dashboards as your operational metrics. Grafana has no Opteryx data source, so it reads the OData service through the Infinity plugin, which queries JSON over HTTP.
Prerequisites
- Grafana. These steps were tested with Grafana 12.2.0 and Infinity 3.11.1, in Docker.
- For the
demoworkspace, nothing else: it's readable without a token, and the example below uses it. - For any other workspace: an opteryx.app client ID and client secret from the Authentication API.
Install
Install the Infinity plugin:
grafana cli plugins install yesoreyeram-infinity-datasourceWith the official Docker image, set GF_INSTALL_PLUGINS instead:
docker run -d --name grafana -p 3000:3000 \
  -e GF_INSTALL_PLUGINS=yesoreyeram-infinity-datasource \
  grafana/grafana:12.2.0
Connection Configuration
Add an Infinity data source. A provisioning file in /etc/grafana/provisioning/datasources/ makes it repeatable:
apiVersion: 1
datasources:
  - name: Opteryx OData
    uid: opteryx-odata
    type: yesoreyeram-infinity-datasource
    jsonData:
      allowedHosts:
        - https://odata.opteryx.app
allowedHosts stops the data source from being used to call any other host. To do the same in the UI, go to Connections → Data sources → Add data source, choose Infinity, and add https://odata.opteryx.app under Security → Allowed hosts.
Authenticating for private workspaces
Anything outside the demo workspace needs credentials. The OData service accepts HTTP Basic authentication with the client ID as the user name and the client secret as the password. It exchanges them for an access token on each request. Add a second data source:
  - name: Opteryx OData (authenticated)
    uid: opteryx-odata-auth
    type: yesoreyeram-infinity-datasource
    basicAuth: true
    basicAuthUser: $OPTERYX_CLIENT_ID
    jsonData:
      auth_method: basicAuth
      allowedHosts:
        - https://odata.opteryx.app
    secureJsonData:
      basicAuthPassword: $OPTERYX_CLIENT_SECRET
Grafana replaces $OPTERYX_CLIENT_ID and $OPTERYX_CLIENT_SECRET with environment variables of the Grafana server process, so the secret stays out of the file. With Docker, pass them with -e OPTERYX_CLIENT_ID -e OPTERYX_CLIENT_SECRET.
Minimal Working Example
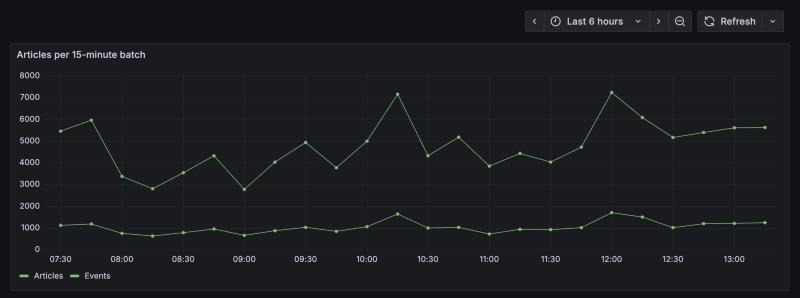
This panel charts how many news articles the GDELT project processed in each 15-minute batch, from demo.geopolitics.gdelt_coverage_by_batch. In a new dashboard, add a Time series panel using the Opteryx OData data source, and set the query to:
Type: JSON, Parser: Backend, Source: URL, Format: Time Series
URL:
https://odata.opteryx.app/api/v4/demo/geopolitics/gdelt_coverage_by_batchHeaders, Request params → URL Query Params:
Key Value $selectdate_added,articles,event_count$filterdate_added ge ${__from:date:iso} and date_added le ${__to:date:iso}$orderbydate_added$top5000Parsing options & Result fields → Rows/Root:
valueColumns: selector
date_addedasTime, format as Time;articlesasArticles, format as Number;event_countasEvents, format as Number
The $filter uses Grafana's ${__from:date:iso} and ${__to:date:iso} variables, so the panel only requests rows in the dashboard's time range. Changing the time picker changes the query.
The same panel as provisioned dashboard JSON:
{
  "uid": "opteryx-gdelt",
  "title": "GDELT coverage (Opteryx)",
  "time": { "from": "now-24h", "to": "now" },
  "panels": [
    {
      "type": "timeseries",
      "title": "Articles per 15-minute batch",
      "gridPos": { "h": 10, "w": 24, "x": 0, "y": 0 },
      "datasource": { "type": "yesoreyeram-infinity-datasource", "uid": "opteryx-odata" },
      "targets": [
        {
          "refId": "A",
          "type": "json",
          "source": "url",
          "parser": "backend",
          "format": "timeseries",
          "url": "https://odata.opteryx.app/api/v4/demo/geopolitics/gdelt_coverage_by_batch",
          "url_options": {
            "method": "GET",
            "params": [
              { "key": "$select", "value": "date_added,articles,event_count" },
              { "key": "$filter", "value": "date_added ge ${__from:date:iso} and date_added le ${__to:date:iso}" },
              { "key": "$orderby", "value": "date_added" },
              { "key": "$top", "value": "5000" }
            ]
          },
          "root_selector": "value",
          "columns": [
            { "selector": "date_added", "text": "Time", "type": "timestamp" },
            { "selector": "articles", "text": "Articles", "type": "number" },
            { "selector": "event_count", "text": "Events", "type": "number" }
          ]
        }
      ]
    }
  ]
}
For a private dataset, select the Opteryx OData (authenticated) data source and change the URL, for example to https://odata.opteryx.app/api/v4/opteryx/test/planets.
Known Limitations and Troubleshooting
- Set
$top. The service returns 100 rows per page by default and links to the next page with@odata.nextLink. Infinity doesn't follow that link, so without$topa panel silently stops at 100 rows. Set$topabove the number of rows you expect. - Aggregate on the server. Each panel refresh is a live query. Use
$filter,$selectand$applyto send back only what the panel draws. See Querying via OData for the syntax. - No SQL. Grafana queries Opteryx through OData, not SQL. For a SQL-based dashboard tool, see Apache Superset.
- Read-only. The OData service doesn't support writes.
401 Unauthorized(shown asunsuccessful HTTP response code) means the request reached a dataset outsidedemowithout credentials. Use the authenticated data source, and check that the environment variables were set when Grafana started.- An empty panel with no error usually means the
$filtermatched nothing in the current time range. Widen the time picker, or check the dataset's timestamp column with the same URL in a browser.